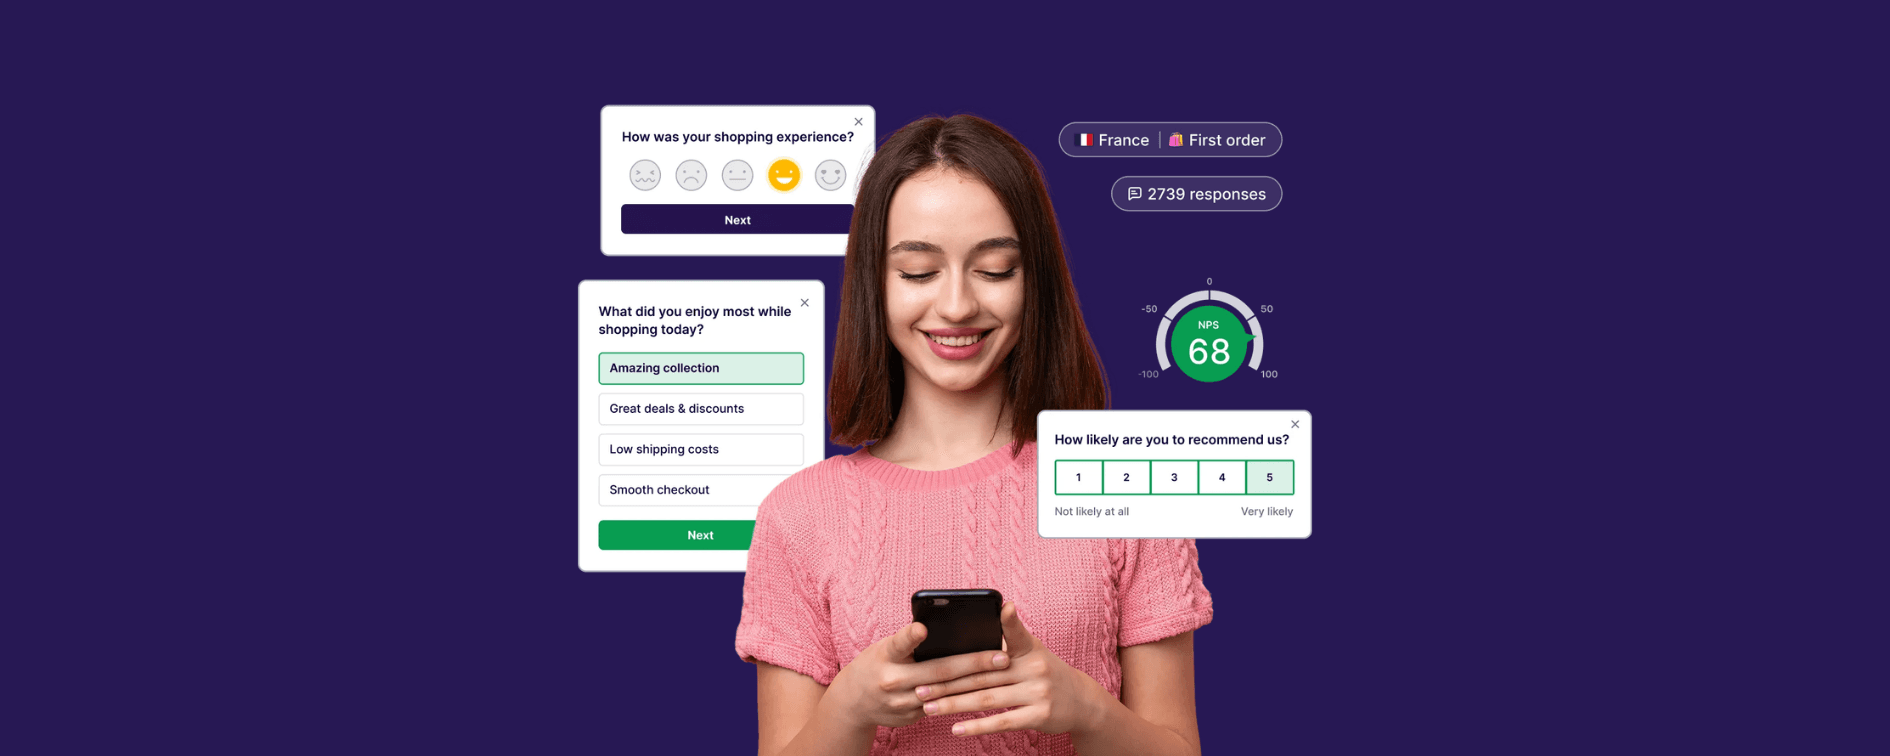
VWO Pulse: When Your Users Tell You Exactly What to Test Next
VWO Pulse brings survey feedback into the same platform where your experiments run. Here's how the closed loop works and why it changes what gets tested.

Mia Nguyen25 May 2026
Many organisations running A/B tests are stuck in the same trap: they're measuring success by win rate, burying inconclusive results, and starting every quarter with a fresh backlog of gut-feel ideas. They're testing, but just not learning.
In a recent webinar with VWO, I broke down why experimentation programs stall, and what the high-performing ones do differently, based on my experiences working with global and local brands in experimentation and Conversion Rate Optimisation (CRO) for over a decade.
In case you’ve missed the webinar, here’s the link to the recording, or you can read through my recap below as well.
Across clients of all sizes, the same three issues come up again and again:
1. Testing without a plan.
No roadmap, no goal tree, no data informing what gets tested. The backlog is just a pool of opinions from whoever spoke up in the last meeting.
2. Nobody actually owns it.
When everyone owns experimentation, nobody does. Without a named driver, there's no accountability for what gets learned, and no one accumulating insights across tests.
3. Win rate as the only metric.
Losing and inconclusive tests get dismissed. But those results still contain information. It just takes a different mindset to extract it.
Only around 1 in 7 experiments will win on the primary metric. That's not a failure, it's the reality of how experimentation works.
The five most common metrics teams test (CTA clicks, revenue, checkout, registration, add-to-cart) actually have relatively low expected impact on their own. Meaningful revenue uplift comes from a sustained program of experiments over time, not from a single winning test. If you're measuring your experimentation program by win rate alone, you're measuring the wrong thing.
A strong hypothesis has three components:
IF WE CHANGE [a specific element]
BECAUSE OUR DATA SHOWS [evidence that supports the assumption]
WE EXPECT [a measurable outcome]
An idea sounds like:
Let's change the button to orange, it might stand out more.
A hypothesis sounds like:
Analytics shows 68% of mobile users drop off at the checkout delivery step. Our user survey shows 75% of customers are satisfied with our delivery speed. If we show estimated delivery time earlier in the flow, we expect fewer abandonments.
One is a guess. The other is an experiment.
One of our real client examples was that we tested moving a product description above the fold on product detail pages for accessories. The overall result was inconclusive. However, when we segmented by device, mobile users showed a 7% uplift in CTA clicks at a 96% confidence on the test variant over the control variant. We decided to roll out the test variant on mobile only.
This is why you always segment your results by device, new vs. returning, acquisition channel, and more. The aggregate view can hide the most important story in your data. This phenomenon even has a name: Simpson's Paradox.
The shift high-performing teams make isn't about running more tests. It's about what they do with every result.
Testing Mindset | Learning Mindset |
|---|---|
Run experiments to find winners | Run experiments to understand behaviour |
Move on after each test concludes | Extract insight from every result, win or lose |
Measure success by win rate | Measure success by revenue impact over time |
Insights stay with whoever ran the test | Insights are documented and shared across teams |
Backlog refills with new ideas | Backlog gets smarter over time |
The most valuable output of any experimentation program isn't a winning variant. It's accumulated knowledge about how your users behave and why.
Whether you're just getting started or fixing a program that's stalled:
Is your data reliable and sufficient? You can't build good hypotheses on bad tracking.
Do you have the right tools, people, and processes in place? Experimentation needs an owner.
Are you using a prioritisation framework (ICE, RICE, PIE, or PXL) to plan your roadmap at least a quarter at a time?
Are you analysing results beyond win rate, segmenting by audience, documenting learnings, and sharing insights across your organisation?
If the answer to any of these is no, that's where to start.
In the webinar, I also walked through ready-to-use templates, including the four most popular prioritisation frameworks (ICE, RICE, PIE, and PXL) and how to apply them, plus three key checklists covering each stage of the experimentation process: from ideation, to execution, to debrief.
If you'd like to get your hands on those templates, watch the webinar recording here or feel free to reach out directly.
We run Discovery sessions to help teams align on goals, identify gaps in their data foundation, and build a smarter experimentation roadmap.

Head of Digital Strategy
Tien leads digital strategy at Paved Digital, bringing extensive experience in driving user-centric, data-led ecommerce growth. She connects business objectives with technology, leading discovery workshops and shaping strategies across SEO, GEO, data, personalisation and experimentation to deliver clear, outcome-driven roadmaps with real business impact.
Stay informed with the latest company news, industry trends, and digital innovation tips.
VWO Pulse brings survey feedback into the same platform where your experiments run. Here's how the closed loop works and why it changes what gets tested.

Most CRO programs fail not because of bad ideas, but because no one truly owns experimentation. Learn how successful organisations structure cross-team experimentation that drives measurable growth.