
Where Travellers Find You Has Changed. Twice.
How the travel industry's shift from shopfront to website is being reshaped again by AI search, and what travel businesses need to do about both.

Mia Nguyen09 Jul 2026

If you’ve seen Fantastic Beasts, you’ll remember the idea: extraordinary creatures hiding in plain sight. Most people walk past them without ever realising what they’re seeing.
Your analytics platform is the same.
The insights you’re looking for are already there. They’re just buried under dashboards, buried under reporting rituals, or buried under the assumption that “we need more data.”
I hear this constantly from ecommerce teams:
We need better tracking.”
“We need a CDP.”
“We need more data before we decide.
Most organisations don’t have a data problem.
They have a decision problem.
Your analytics stack is already collecting signals powerful enough to drive growth. The issue isn’t missing data. It’s that no one has built a system for turning those signals into action.
That’s where the real gap is.
Let me paint a familiar picture. Your team has Google Analytics 4, perhaps Hotjar or similar, maybe a CDP or marketing automation platform.
Every week, someone generates reports. Traffic is up. Engagement rate is... well, it's a number. Conversions happened. The dashboard gets reviewed, someone says "interesting," and everyone moves on.
This is reporting, not decision-making.
The gap isn't what you're measuring - it's what you're doing with it. Dashboard overload creates a false sense of insight. You're collecting data, reviewing metrics, nodding along. But when it comes time to decide what to improve, what to test, or where to invest resources, teams often revert to gut feel or whoever argues loudest in the room.
Meanwhile, the reports that could drive decisions - the ones that reveal why people leave, where friction exists, what customers are searching for and not finding - those reports exist. They're just not being used as decision tools. They're treated as performance scorecards, not growth signals.
The uncomfortable truth: Most organisations could double their use of existing data before needing new tracking or tools.
Let me show you the reports that are probably already available in your analytics setup - and what they're telling you.
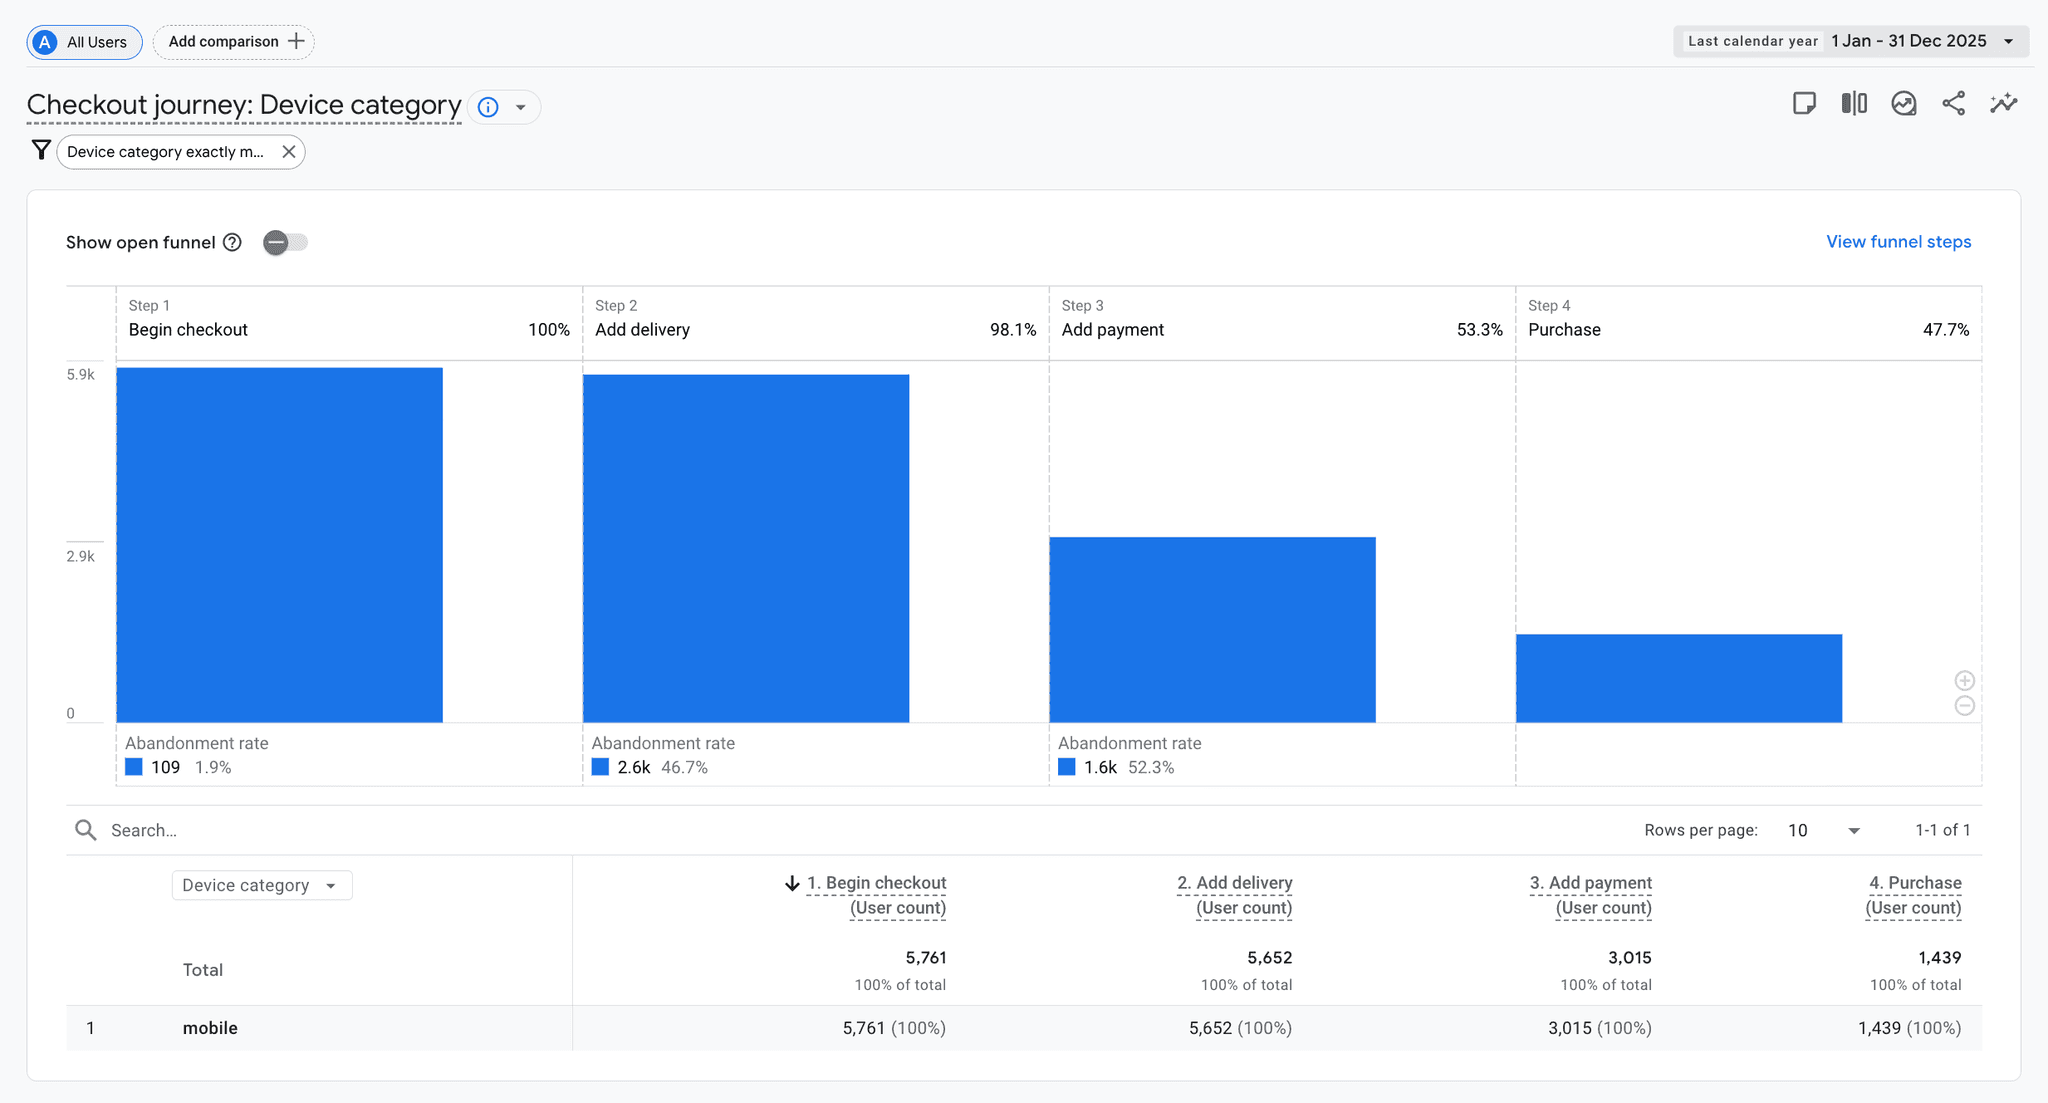
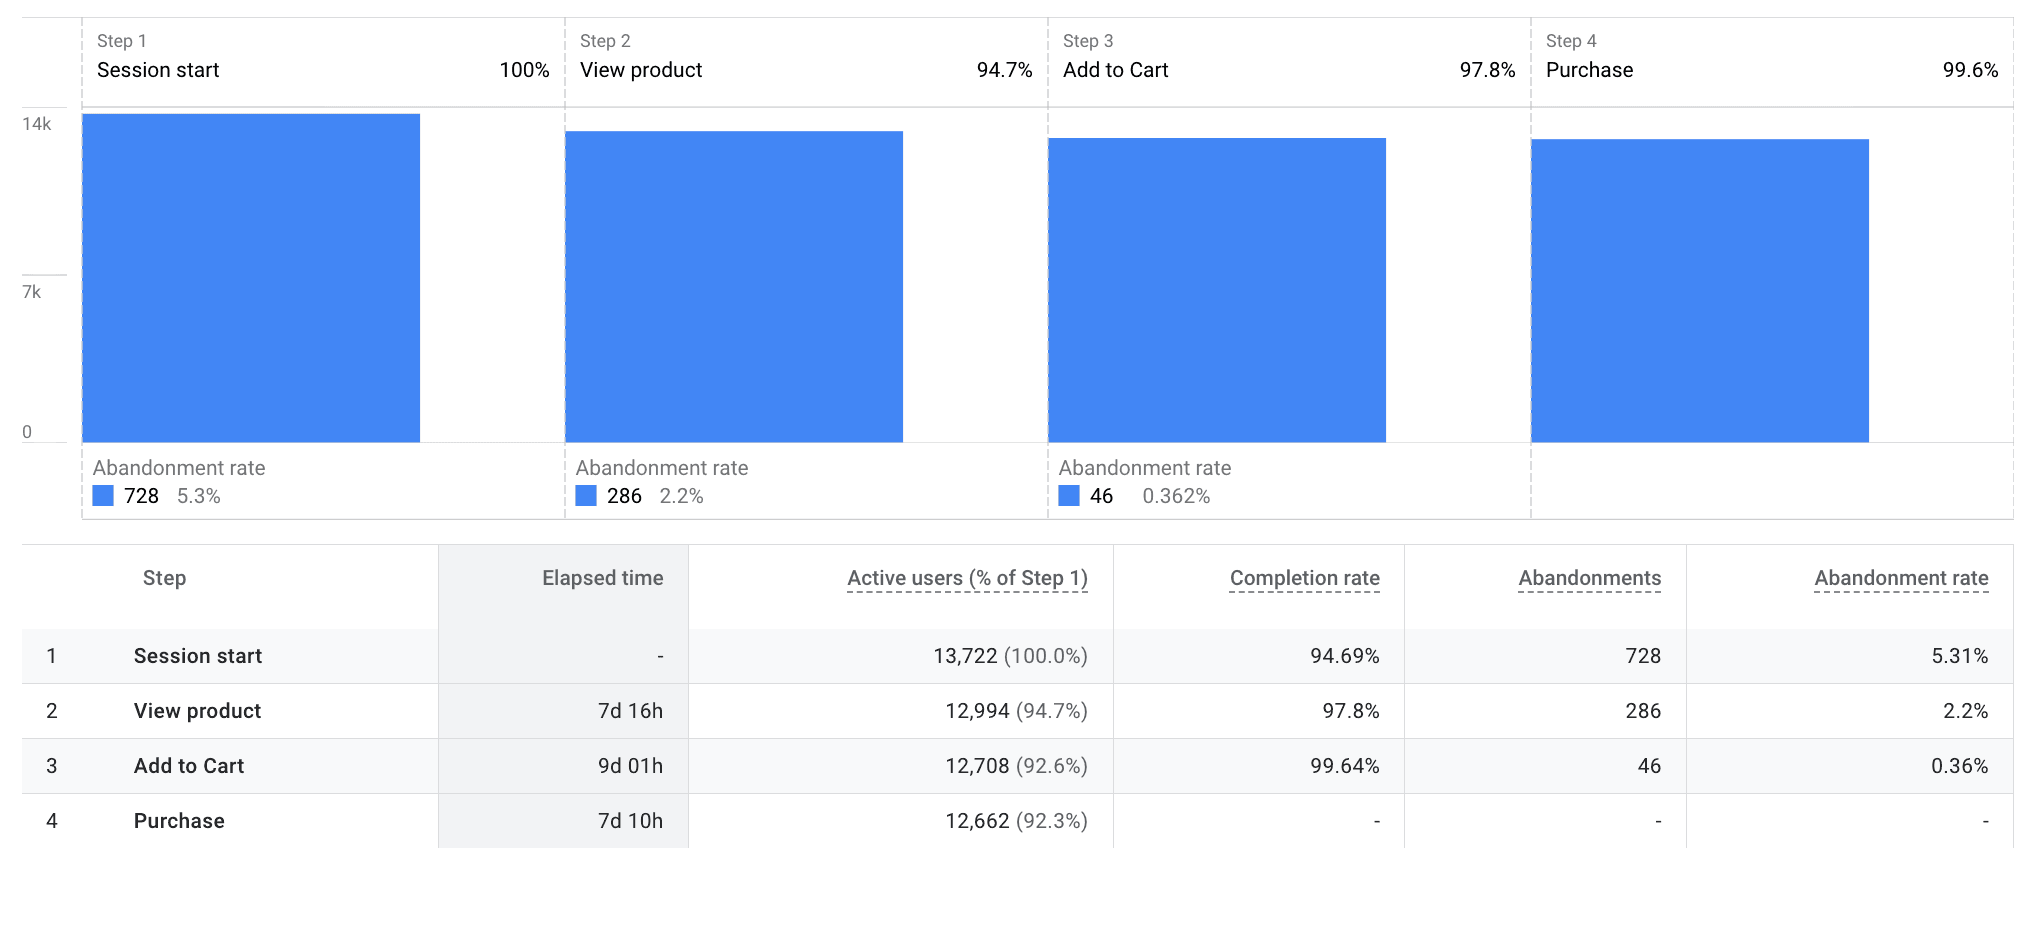
What it reveals: Where people abandon your conversion flow - whether that's checkout, signup, or any multi-step process.
Where it lives: Google Analytics 4 has funnel exploration reports. Most ecommerce platforms have checkout funnel analytics built in.
Why it matters: If 50% of users drop off at the payment options page, you're looking at a clear signal. But here's what makes this complex: Is it because of slow page load speed? Unclear or missing options? Missing information? Lack of trust signals? Do users continue to another page or leave our website altogether? The drop-off tells you where the problem is, but not what the problem is or how to fix it.
What teams miss: They see the numbers, acknowledge the problem, then stop there - using the data to identify the symptom, but never the disease.
What it reveals: Pages that get lots of visitors but lose them - people arrive, spend time, then leave without converting or continuing deeper into the site.
Where it lives: Google Analytics landing page reports crossed with exit rate. Filter for pages with above-average traffic but high exit rates.
Why it matters: These pages are working (they're attracting traffic) but failing (they're not converting). The challenge is understanding why. Is it unclear next steps? Missing information? Mismatched intent? Poor calls to action? The data identifies the opportunity but doesn't reveal the solution.
What teams miss: They know these pages exist but don't know how to prioritise which ones to fix first, or what changes would actually move the needle.
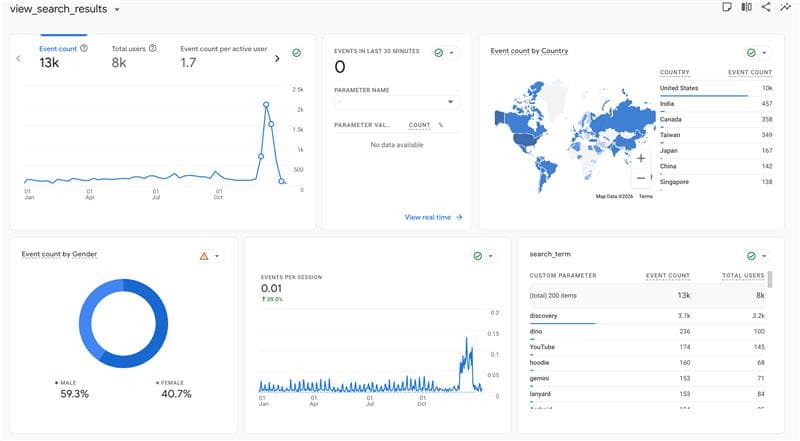
What it reveals: What people are searching for on your site - and critically, which searches return zero results or lead to exits.
Where it lives: If you have site search enabled, GA4 captures search terms. Ecommerce platforms typically log internal searches as well. You may need to implement custom event tracking on GA4 to see the average clickthrough rate of each search term, or users’ interaction with the search dropdown, not just their behaviors on the search results page.
Why it matters: Site search data is direct customer intent - they're literally telling you what they want. When searches fail or lead to exits, you're losing ready-to-buy customers. But interpreting this data requires context. Are people searching because navigation is unclear? Because product categorisation is confusing? Because they want something you don't stock? Each scenario requires a different response. Many times, it’s simply because your language and your users’ mismatch, so implementing autocomplete, search suggestion, related queries or best bets (aka featured results) could go a long way.
What teams miss: They look at top searches without investigating why people are searching in the first place, or what happens after those searches.
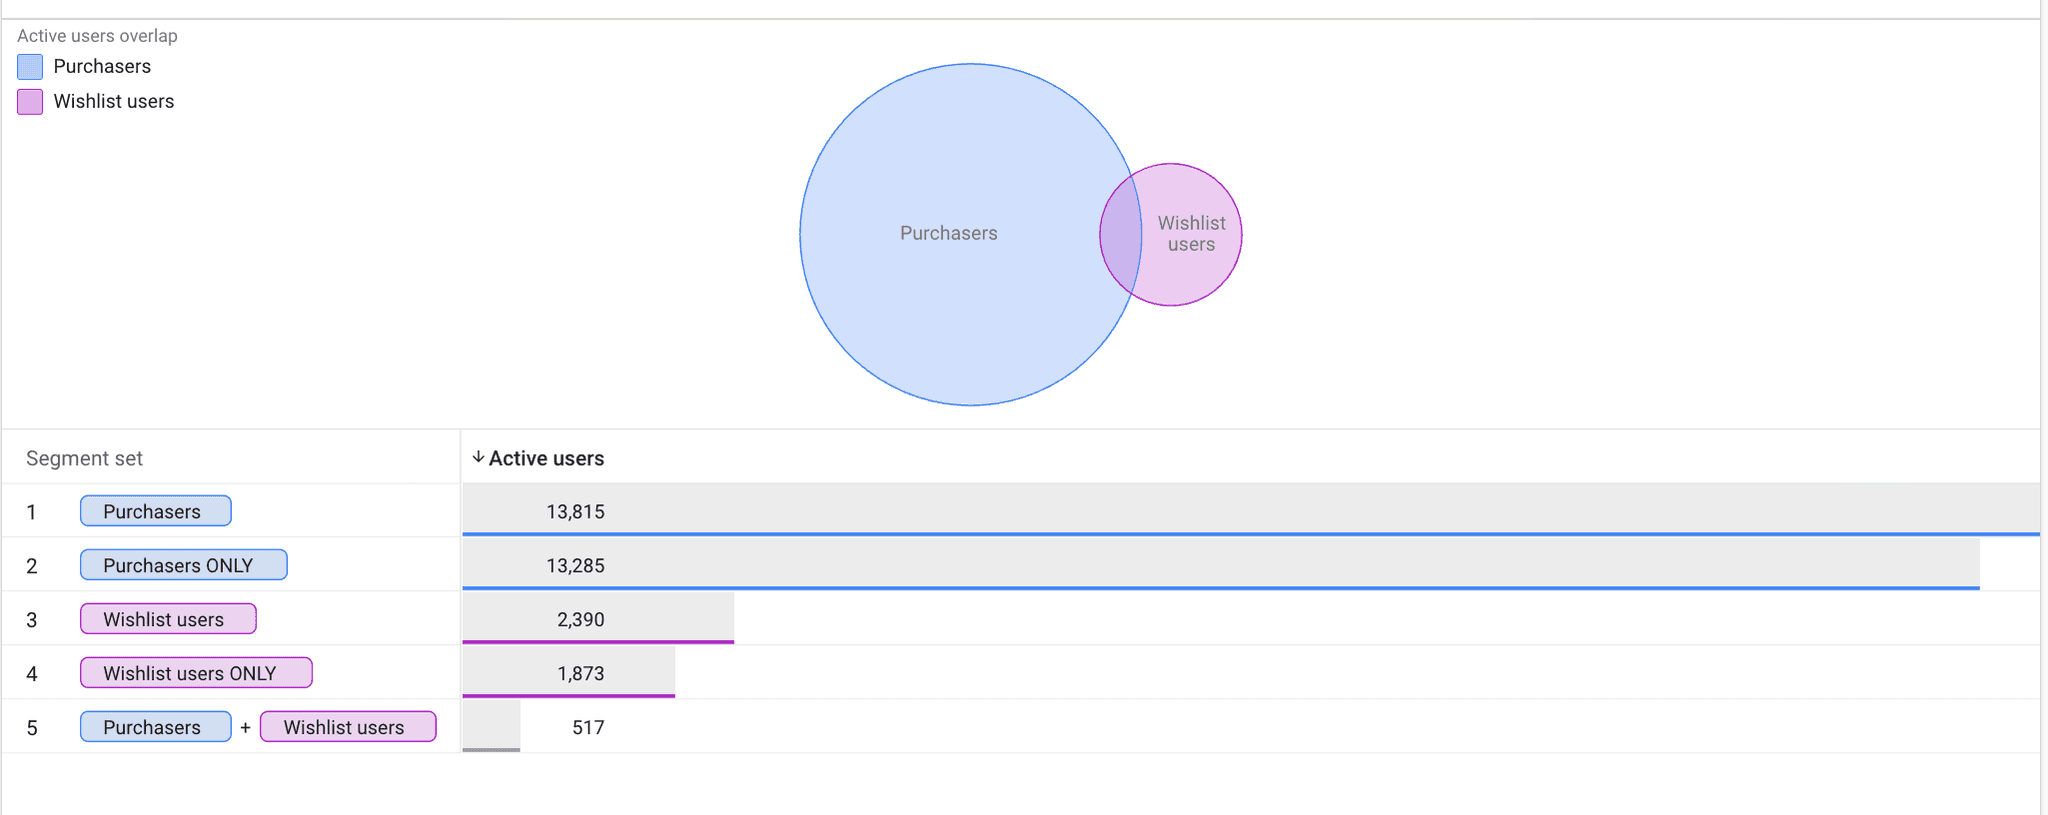
What it reveals: The smaller actions that lead to purchase – product comparison, wishlist add, zip code input or delivery cost calculator click, account creation, email signup - and where these behaviours don't convert to the next step.
Where it lives: Custom events in GA4, ecommerce platform analytics, or marketing automation tools that track engagement actions.
Why it matters: If 500 people add products to wishlist but only 20 ever purchase from that wishlist, you have a gap. But is it a wishlist functionality problem? A reminder/email problem? A pricing perception issue? The gap is visible, but the fix isn't obvious.
What teams miss: They measure these actions but don't map the relationships between them, so they can't see where the conversion journey breaks down.
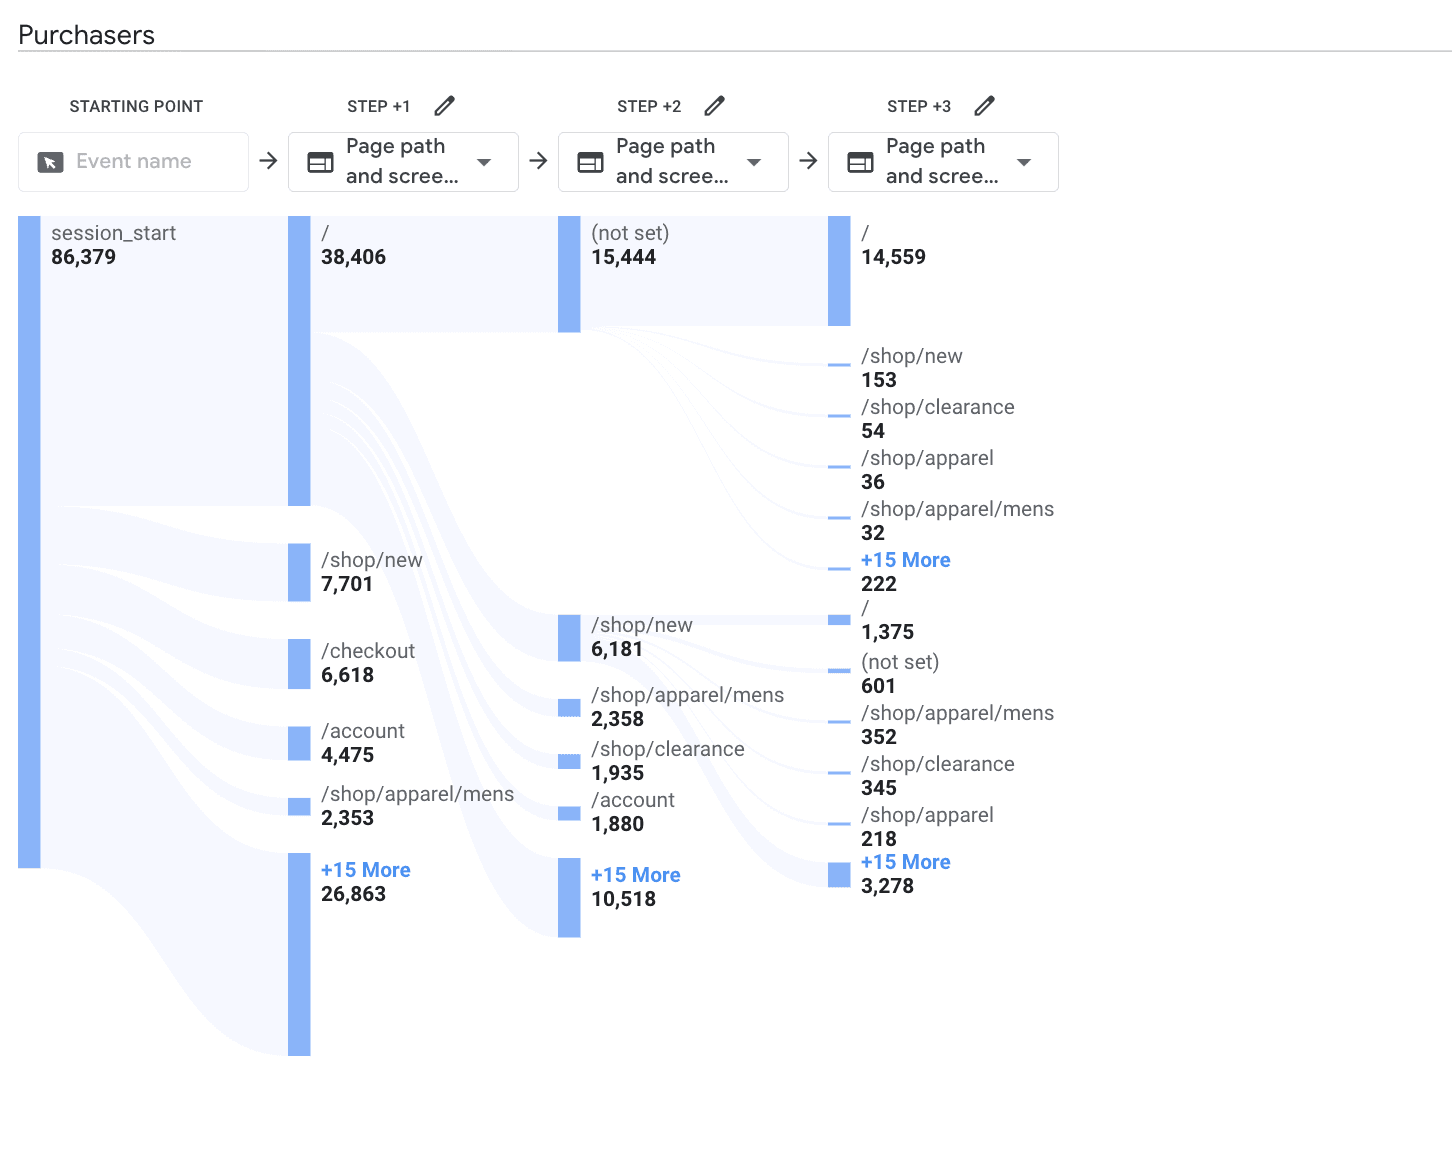
What it reveals: How people move through your site before converting - which pages they visit, in what order, and how long it takes from first visit to purchase.
Where it lives: Path exploration in GA4, customer journey reports in analytics platforms, cohort analysis tools.
Why it matters: If most converters visit the FAQ page before purchasing, that's a signal. But what does it mean? Are product pages missing key information? Are there unaddressed objections? Should FAQs be surfaced earlier? The pattern tells you something is happening - interpreting what and why requires deeper analysis.
What teams miss: They see the aggregate behaviour but struggle to translate patterns into actionable changes. Understanding correlation isn't the same as understanding causation.
If these reports are so valuable and already available, why aren't teams using them?
1. Lack of growth questions
Most teams look at data and ask, "what happened?" They don't have a framework for translating numbers into strategic questions. What should we do? What's the root cause? What would move the needle most? Without this discipline, data remains descriptive, not diagnostic.
2. No ownership
Analytics often sits with a specialist who generates reports but doesn't have authority to act on them. Meanwhile, the people who could act (product, marketing, ecommerce managers) don't own the data process. Result: insights sit in reports no one acts on.
3. Too many dashboards
When everything is a dashboard, nothing is actionable. Teams spend time reviewing 20 metrics when they should focus on the 3-5 signals that actually drive growth. More visibility doesn't equal more insight - it often creates analysis paralysis.
4. No prioritisation model
Even when teams spot issues - high exit rates, funnel drop-offs, failed searches - they struggle to decide what to fix first. Without a framework for prioritising impact versus effort, everything feels equally urgent, so nothing moves forward decisively.
Here's where most teams get stuck. They pull the reports. They see the problems. Then nothing happens, or the wrong things get prioritised.
The challenge isn't finding the data - it's knowing what to do with it.
Teams pull a funnel report, see a drop-off, and either make a change based on assumption (which might make things worse), debate endlessly about what might work (analysis paralysis), or add it to a backlog that never gets prioritised.
What's missing isn't data. It's a structured approach to interpreting what the data means, diagnosing root causes, designing interventions, and prioritising based on impact.
The teams that succeed don't just have better analytics - they have better processes. They've built frameworks for prioritisation. They've assigned ownership so insights don't sit unused. They treat data as an input to decisions, not a performance scorecard.
But building this capability internally is hard. It requires analytics expertise, strategic thinking, CRO knowledge, testing discipline, and cross-functional coordination. Most organisations have bits of this scattered across different teams. Few have it working as an integrated system.
The fantastic numbers are already there.
The question isn’t:
Are we tracking enough?
It’s:
Do we have a system for turning insight into action?
Because insights without decisions are just numbers.
And dashboards without ownership are just decoration.
If your analytics feels underutilised, it probably is.
Let’s change that.
👉 Talk to us about turning your existing data into measurable growth.

Data Scientist
Trung brings deep expertise in exploratory data analysis, automation, and data systems architecture at Paved Digital. With a strong technical foundation and developer background, he bridges business objectives with scalable data solutions. From executive dashboards to full data audits, Trung transforms complex datasets into actionable insights that drive measurable growth.
Stay informed with the latest company news, industry trends, and digital innovation tips.
How the travel industry's shift from shopfront to website is being reshaped again by AI search, and what travel businesses need to do about both.

A GA4 audit checklist for ecommerce teams covering the tracking gaps that distort revenue data, attribution and funnel reporting in setups that look correct on the surface.